10 Themes
El sistemas de temas (themes) de ggplot2 nos permite modificar todos aquellos elementos del gráfico que no tienen nada que ver con los datos. Estos no afectan a cómo los datos se compilan a través de las geometrías o cómo se transforman con las escalas (Wickham, Navarro, y Pedersen 2021). El objetivo de los temas es hacer la visualización mucho más atractiva
En este capítulo vamos a trabajar con un dataset:
-
iris: se utilizará para los ejemplos utilizados en las explicaciones (ver Tipos de visualización).
Para comenzar, vamos a cargar los paquetes necesarios y a leer los datos que utilizaremos en este capítulo.
10.1 El objeto ggplot2
Antes de comenzar con los temas, vamos a observar la estructura de un objeto de ggplot2:
iris_gg <- iris |>
    ggplot(
        aes(x = Petal.Length, fill = Species)
    ) +
    geom_histogram(bins = 30, color = "white") +
    labs(
        title    = "Distribución de longitud del pétalo por especie",
        subtitle = "La especie I. setosa tiene una longitud de pétalo menor que I. versicolor e I. virginica",
        x        = "Longitud (mm)",
        y        = "Frecuencia",
        caption  = "Autor: Adrián Cidre"
    )

iris_gg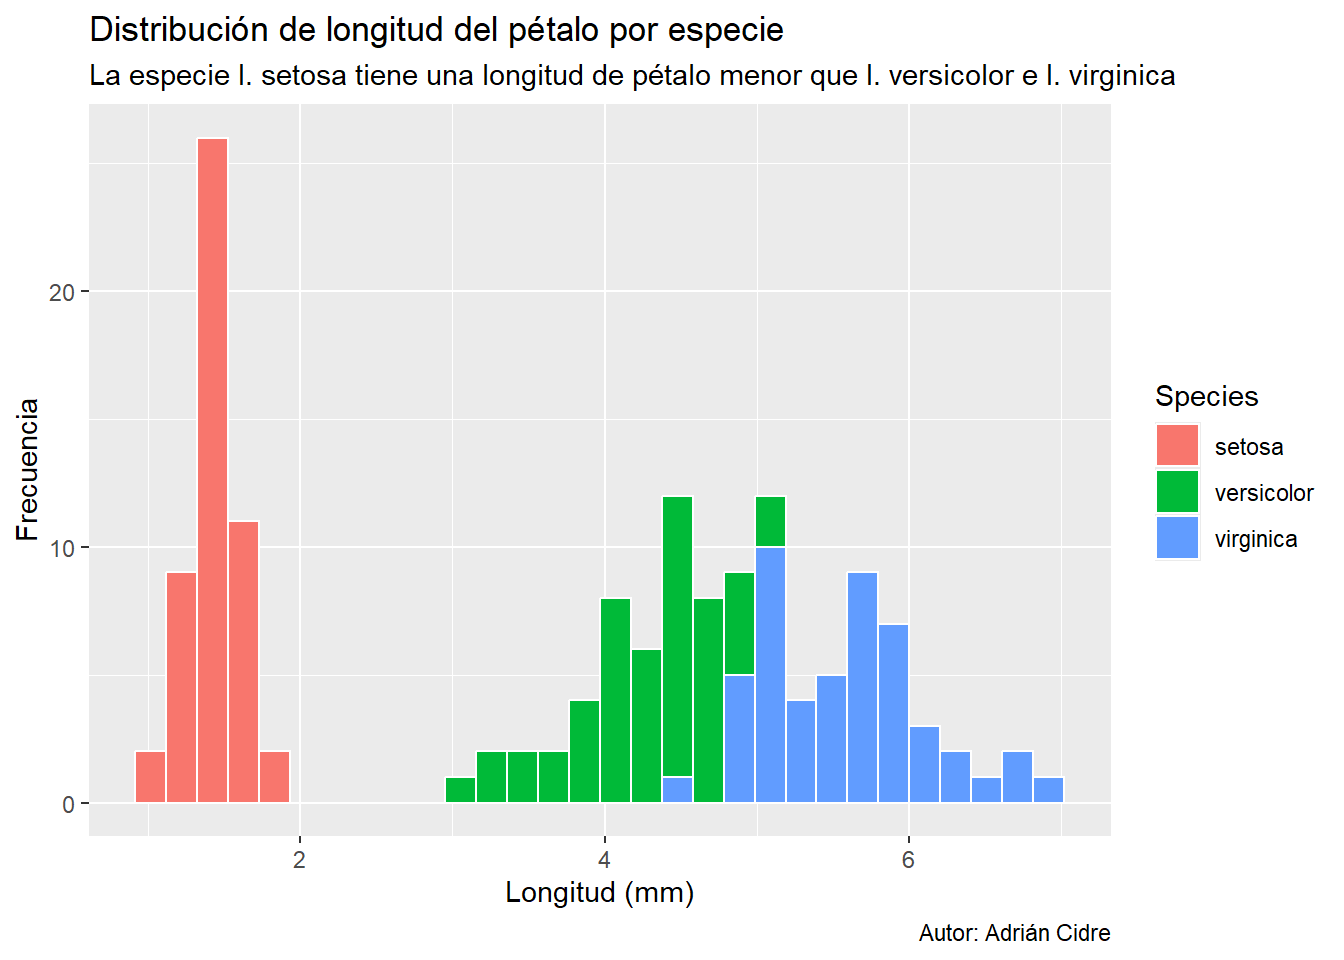
En este caso tenemos un histograma que hemos creado en la Capítulo 4 con el tema predefinido de ggplot2. Si vamos a la pestaña Environment podemos ver que es una lista con 11 elementos Figura 10.1.
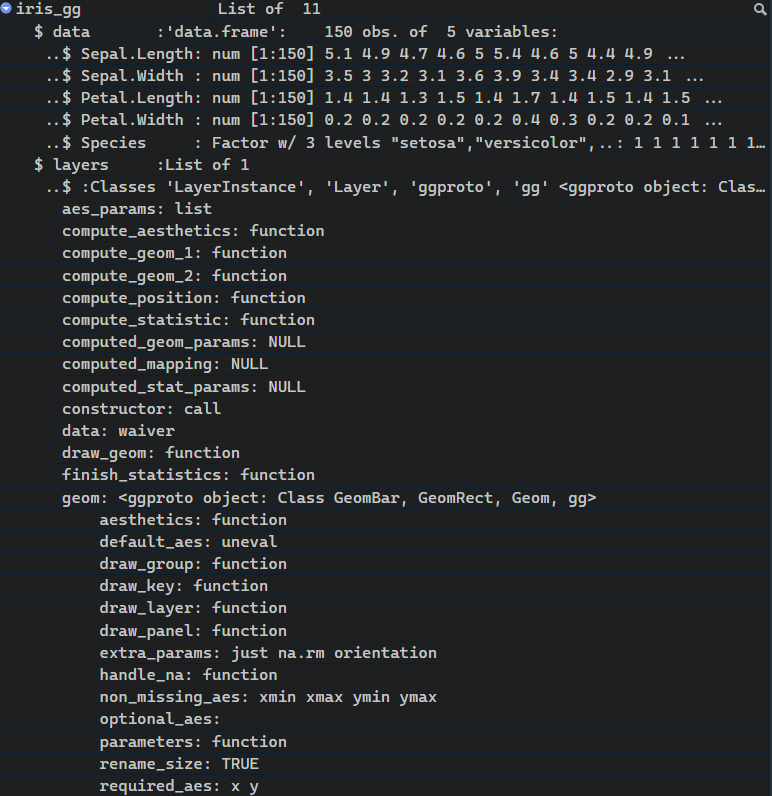
Entre los 11 elementos tenemos uno que se llama theme y que podemos imprimir del siguiente modo:
iris_gg$themeVemos que es una lista vacía. Si añadimos un tema completo o predefinido e imprimimos el tema de nuevo:
iris_gg <- iris_gg + theme_minimal()

iris_gg$theme
List of 136
$ line :List of 6
..$ colour : chr "black"
..$ linewidth : num 0.5
..$ linetype : num 1
..$ lineend : chr "butt"
..$ arrow : logi FALSE
..$ inherit.blank: logi TRUE
..- attr(*, "class")= chr [1:2] "element_line" "element"
$ rect :List of 5
..$ fill : chr "white"
..$ colour : chr "black"
..$ linewidth : num 0.5
..$ linetype : num 1
..$ inherit.blank: logi TRUE
..- attr(*, "class")= chr [1:2] "element_rect" "element"
$ text :List of 11
..$ family : chr ""
..$ face : chr "plain"
..$ colour : chr "black"
..$ size : num 11
..$ hjust : num 0.5
..$ vjust : num 0.5
..$ angle : num 0
..$ lineheight : num 0.9
..$ margin : 'margin' num [1:4] 0points 0points 0points 0points
.. ..- attr(*, "unit")= int 8
..$ debug : logi FALSE
..$ inherit.blank: logi TRUE
..- attr(*, "class")= chr [1:2] "element_text" "element"
$ title : NULL
$ aspect.ratio : NULL
$ axis.title : NULL
$ axis.title.x :List of 11
..$ family : NULL
..$ face : NULL
..$ colour : NULL
..$ size : NULL
..$ hjust : NULL
..$ vjust : num 1
..$ angle : NULL
..$ lineheight : NULL
..$ margin : 'margin' num [1:4] 2.75points 0points 0points 0points
.. ..- attr(*, "unit")= int 8
..$ debug : NULL
..$ inherit.blank: logi TRUE
..- attr(*, "class")= chr [1:2] "element_text" "element"
$ axis.title.x.top :List of 11
..$ family : NULL
..$ face : NULL
..$ colour : NULL
..$ size : NULL
..$ hjust : NULL
..$ vjust : num 0
..$ angle : NULL
..$ lineheight : NULL
..$ margin : 'margin' num [1:4] 0points 0points 2.75points 0points
.. ..- attr(*, "unit")= int 8
..$ debug : NULL
..$ inherit.blank: logi TRUE
..- attr(*, "class")= chr [1:2] "element_text" "element"
$ axis.title.x.bottom : NULL
$ axis.title.y :List of 11
..$ family : NULL
..$ face : NULL
..$ colour : NULL
..$ size : NULL
..$ hjust : NULL
..$ vjust : num 1
..$ angle : num 90
..$ lineheight : NULL
..$ margin : 'margin' num [1:4] 0points 2.75points 0points 0points
.. ..- attr(*, "unit")= int 8
..$ debug : NULL
..$ inherit.blank: logi TRUE
..- attr(*, "class")= chr [1:2] "element_text" "element"
$ axis.title.y.left : NULL
$ axis.title.y.right :List of 11
..$ family : NULL
..$ face : NULL
..$ colour : NULL
..$ size : NULL
..$ hjust : NULL
..$ vjust : num 1
..$ angle : num -90
..$ lineheight : NULL
..$ margin : 'margin' num [1:4] 0points 0points 0points 2.75points
.. ..- attr(*, "unit")= int 8
..$ debug : NULL
..$ inherit.blank: logi TRUE
..- attr(*, "class")= chr [1:2] "element_text" "element"
$ axis.text :List of 11
..$ family : NULL
..$ face : NULL
..$ colour : chr "grey30"
..$ size : 'rel' num 0.8
..$ hjust : NULL
..$ vjust : NULL
..$ angle : NULL
..$ lineheight : NULL
..$ margin : NULL
..$ debug : NULL
..$ inherit.blank: logi TRUE
..- attr(*, "class")= chr [1:2] "element_text" "element"
$ axis.text.x :List of 11
..$ family : NULL
..$ face : NULL
..$ colour : NULL
..$ size : NULL
..$ hjust : NULL
..$ vjust : num 1
..$ angle : NULL
..$ lineheight : NULL
..$ margin : 'margin' num [1:4] 2.2points 0points 0points 0points
.. ..- attr(*, "unit")= int 8
..$ debug : NULL
..$ inherit.blank: logi TRUE
..- attr(*, "class")= chr [1:2] "element_text" "element"
$ axis.text.x.top :List of 11
..$ family : NULL
..$ face : NULL
..$ colour : NULL
..$ size : NULL
..$ hjust : NULL
..$ vjust : num 0
..$ angle : NULL
..$ lineheight : NULL
..$ margin : 'margin' num [1:4] 0points 0points 2.2points 0points
.. ..- attr(*, "unit")= int 8
..$ debug : NULL
..$ inherit.blank: logi TRUE
..- attr(*, "class")= chr [1:2] "element_text" "element"
$ axis.text.x.bottom : NULL
$ axis.text.y :List of 11
..$ family : NULL
..$ face : NULL
..$ colour : NULL
..$ size : NULL
..$ hjust : num 1
..$ vjust : NULL
..$ angle : NULL
..$ lineheight : NULL
..$ margin : 'margin' num [1:4] 0points 2.2points 0points 0points
.. ..- attr(*, "unit")= int 8
..$ debug : NULL
..$ inherit.blank: logi TRUE
..- attr(*, "class")= chr [1:2] "element_text" "element"
$ axis.text.y.left : NULL
$ axis.text.y.right :List of 11
..$ family : NULL
..$ face : NULL
..$ colour : NULL
..$ size : NULL
..$ hjust : num 0
..$ vjust : NULL
..$ angle : NULL
..$ lineheight : NULL
..$ margin : 'margin' num [1:4] 0points 0points 0points 2.2points
.. ..- attr(*, "unit")= int 8
..$ debug : NULL
..$ inherit.blank: logi TRUE
..- attr(*, "class")= chr [1:2] "element_text" "element"
$ axis.text.theta : NULL
$ axis.text.r :List of 11
..$ family : NULL
..$ face : NULL
..$ colour : NULL
..$ size : NULL
..$ hjust : num 0.5
..$ vjust : NULL
..$ angle : NULL
..$ lineheight : NULL
..$ margin : 'margin' num [1:4] 0points 2.2points 0points 2.2points
.. ..- attr(*, "unit")= int 8
..$ debug : NULL
..$ inherit.blank: logi TRUE
..- attr(*, "class")= chr [1:2] "element_text" "element"
$ axis.ticks : list()
..- attr(*, "class")= chr [1:2] "element_blank" "element"
$ axis.ticks.x : NULL
$ axis.ticks.x.top : NULL
$ axis.ticks.x.bottom : NULL
$ axis.ticks.y : NULL
$ axis.ticks.y.left : NULL
$ axis.ticks.y.right : NULL
$ axis.ticks.theta : NULL
$ axis.ticks.r : NULL
$ axis.minor.ticks.x.top : NULL
$ axis.minor.ticks.x.bottom : NULL
$ axis.minor.ticks.y.left : NULL
$ axis.minor.ticks.y.right : NULL
$ axis.minor.ticks.theta : NULL
$ axis.minor.ticks.r : NULL
$ axis.ticks.length : 'simpleUnit' num 2.75points
..- attr(*, "unit")= int 8
$ axis.ticks.length.x : NULL
$ axis.ticks.length.x.top : NULL
$ axis.ticks.length.x.bottom : NULL
$ axis.ticks.length.y : NULL
$ axis.ticks.length.y.left : NULL
$ axis.ticks.length.y.right : NULL
$ axis.ticks.length.theta : NULL
$ axis.ticks.length.r : NULL
$ axis.minor.ticks.length : 'rel' num 0.75
$ axis.minor.ticks.length.x : NULL
$ axis.minor.ticks.length.x.top : NULL
$ axis.minor.ticks.length.x.bottom: NULL
$ axis.minor.ticks.length.y : NULL
$ axis.minor.ticks.length.y.left : NULL
$ axis.minor.ticks.length.y.right : NULL
$ axis.minor.ticks.length.theta : NULL
$ axis.minor.ticks.length.r : NULL
$ axis.line : list()
..- attr(*, "class")= chr [1:2] "element_blank" "element"
$ axis.line.x : NULL
$ axis.line.x.top : NULL
$ axis.line.x.bottom : NULL
$ axis.line.y : NULL
$ axis.line.y.left : NULL
$ axis.line.y.right : NULL
$ axis.line.theta : NULL
$ axis.line.r : NULL
$ legend.background : list()
..- attr(*, "class")= chr [1:2] "element_blank" "element"
$ legend.margin : 'margin' num [1:4] 5.5points 5.5points 5.5points 5.5points
..- attr(*, "unit")= int 8
$ legend.spacing : 'simpleUnit' num 11points
..- attr(*, "unit")= int 8
$ legend.spacing.x : NULL
$ legend.spacing.y : NULL
$ legend.key : list()
..- attr(*, "class")= chr [1:2] "element_blank" "element"
$ legend.key.size : 'simpleUnit' num 1.2lines
..- attr(*, "unit")= int 3
$ legend.key.height : NULL
$ legend.key.width : NULL
$ legend.key.spacing : 'simpleUnit' num 5.5points
..- attr(*, "unit")= int 8
$ legend.key.spacing.x : NULL
$ legend.key.spacing.y : NULL
$ legend.frame : NULL
$ legend.ticks : NULL
$ legend.ticks.length : 'rel' num 0.2
$ legend.axis.line : NULL
$ legend.text :List of 11
..$ family : NULL
..$ face : NULL
..$ colour : NULL
..$ size : 'rel' num 0.8
..$ hjust : NULL
..$ vjust : NULL
..$ angle : NULL
..$ lineheight : NULL
..$ margin : NULL
..$ debug : NULL
..$ inherit.blank: logi TRUE
..- attr(*, "class")= chr [1:2] "element_text" "element"
$ legend.text.position : NULL
$ legend.title :List of 11
..$ family : NULL
..$ face : NULL
..$ colour : NULL
..$ size : NULL
..$ hjust : num 0
..$ vjust : NULL
..$ angle : NULL
..$ lineheight : NULL
..$ margin : NULL
..$ debug : NULL
..$ inherit.blank: logi TRUE
..- attr(*, "class")= chr [1:2] "element_text" "element"
$ legend.title.position : NULL
$ legend.position : chr "right"
$ legend.position.inside : NULL
$ legend.direction : NULL
$ legend.byrow : NULL
$ legend.justification : chr "center"
$ legend.justification.top : NULL
$ legend.justification.bottom : NULL
$ legend.justification.left : NULL
$ legend.justification.right : NULL
$ legend.justification.inside : NULL
$ legend.location : NULL
$ legend.box : NULL
$ legend.box.just : NULL
$ legend.box.margin : 'margin' num [1:4] 0cm 0cm 0cm 0cm
..- attr(*, "unit")= int 1
$ legend.box.background : list()
..- attr(*, "class")= chr [1:2] "element_blank" "element"
$ legend.box.spacing : 'simpleUnit' num 11points
..- attr(*, "unit")= int 8
[list output truncated]
- attr(*, "class")= chr [1:2] "theme" "gg"
- attr(*, "complete")= logi TRUE
- attr(*, "validate")= logi TRUEVemos una lista enorme. Pues esto son básicamente los temas. Una lista enorme que podemos modificar a través de una función con muchos argumentos. Como podéis ver, algunos argumentos tienen valores, mientras que otros son NULL (estos últimos son argumentos vacíos).
10.2 Temas completos
Los temas completos (complete themes) son aquellos que han sido creados por otras personas y que podemos utilizar a través de una función con pocos argumentos que tiene la estructura *theme_*(), donde * es el nombre del tema. Con el paquete ggplot2 tenemos varios que vienen por defecto como son:
#| standalone: true
#| viewerHeight: 600

## Load packages
library(bslib)
library(dplyr)
library(ggplot2)
library(glue)
library(shiny)

## UI
ui <- page_sidebar(
    sidebar = sidebar(
        open = "open",
        width = 200,
        selectInput(
            inputId = "theme",
            label   = "Theme",
            choices =  c(
                "theme_bw",
                "theme_classic",
                "theme_dark",
                "theme_gray",
                "theme_light",
                "theme_linedraw",
                "theme_minimal",
                "theme_void"
                ),
            selected = "fixed"
        )
    ),
    verbatimTextOutput("code") |> card(),
    plotOutput("plot", width = 500, height = 430) |> card()
)

## Server
server <- function(input, output, session) {

    output$code <- renderPrint({
        glue(
            '
            iris_gg +
                {input$theme}()
            '
            )
    })

    ## Plot
    output$plot <- renderPlot({
        iris |>
            ggplot(
                aes(x = Petal.Length, fill = Species)
            ) +
            geom_histogram(bins = 30, color = "white") +
            labs(
                title    = "Distribución de longitud del pétalo por especie",
                subtitle = "La especie I. setosa tiene una longitud de pétalo menor que I. versicolor e I. virginica",
                x        = "Longitud (mm)",
                y        = "Frecuencia",
                caption  = "Autor: Adrián Cidre"
            ) +
            get(input$theme)(base_size = 8)
        }, res = 96
    )
}

## Run app
shinyApp(ui = ui, server = server)
Existen otros paquetes como ggthemes o hrbhthemes que traen más temas completos. En la siguiente aplicación puedes probar los disponibles en el paquete ggthemes:
#| standalone: true
#| viewerHeight: 600

## Load packages
library(bslib)
library(dplyr)
library(ggplot2)
library(ggthemes)
library(glue)
library(shiny)

## UI
ui <- page_sidebar(
    sidebar = sidebar(
        open = "open",
        width = 250,
        selectInput(
            inputId = "theme",
            label   = "ggthemes",
            choices = c(
              "theme_economist",
              "theme_economist_white",
              "theme_few",
              "theme_fivethirtyeight",
              "theme_gdocs",
              "theme_hc",
              "theme_igray",
              "theme_map",
              "theme_pander",
              "theme_par",
              "theme_solarized",
              "theme_solarized_2",
              "theme_stata",
              "theme_tufte",
              "theme_wsj"
            ),
            selected = "fixed"
        )
    ),
    verbatimTextOutput("code") |> card(),
    plotOutput("plot", width = 500, height = 430) |> card()
)

## Server
server <- function(input, output, session) {

    output$code <- renderPrint({
        glue(
            '
            iris_gg +
                {input$theme}()
            '
            )
    })

    ## Plot
    output$plot <- renderPlot({
        iris |>
            ggplot(
                aes(x = Petal.Length, fill = Species)
            ) +
            geom_histogram(bins = 30, color = "white") +
            labs(
                title    = "Distribución de longitud del pétalo por especie",
                subtitle = "La especie I. setosa tiene una longitud de pétalo menor que I. versicolor e I. virginica",
                x        = "Longitud (mm)",
                y        = "Frecuencia",
                caption  = "Autor: Adrián Cidre"
            ) +
            get(input$theme)(base_size = 8)
        }, res = 96
    )
}

## Run app
shinyApp(ui = ui, server = server)
Estos temas son generalmente un buen punto de partida, pero en la mayoría de nuestras visualizaciones querremos ir más allá y controlar el aspecto de nuestros elementos de forma más concreta.
10.3 Modificar componentes
Si queremos modificar elementos individuales vamos a utilizar la función theme(). Dentro de esta función vamos a utilizar una estructura particular para los argumentos:
iris_gg +
    theme(
        nombre_elemento = funcion_elemento(argumentos)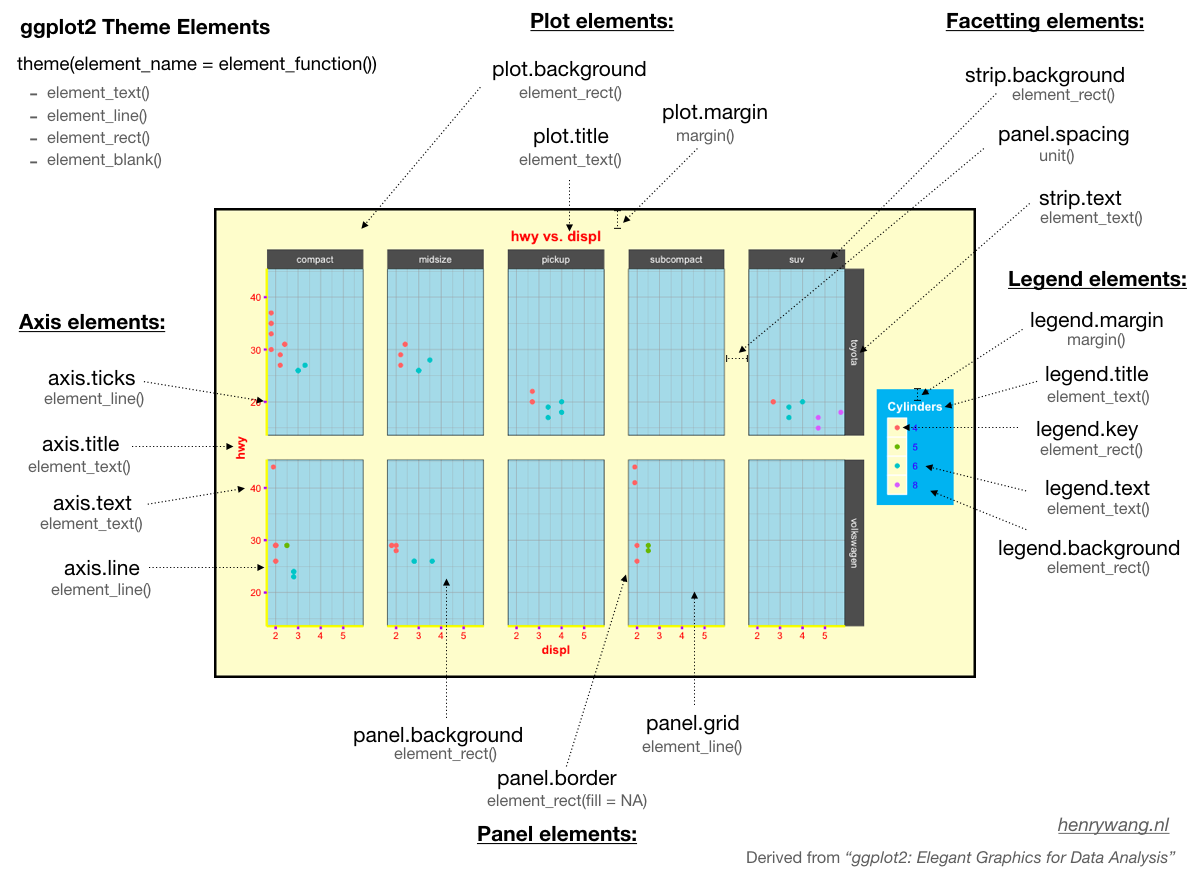
)- nombre_elemento: el nombre del elemento se refiere a qué queremos modificar. En la Figura 10.2 serían elementos como plot.background, plot.title, legend.title, panel.background…
-
funcion_elemento: es una función que se aplica al elemento. Cada elemento tiene una sola función que va a ser element_text, element_line o element_rect. Además, todos los elementos puedes tener element_blank que es básicamente eliminar ese elemento.
-
element_text: será utilizada por elementos de texto tales como plot.title, axis.text, legend.text, legend.title, etc. -
element_line: será utilizada por elementos lineares como las líneas de la grilla (axis.line, panel.grid) u otros (axis.ticks…). -
element_rect: será utilizada por elementos rectangulares que tienen contorno y relleno (panel.background, plot.background, legend.key, legend.background…). -
element_blank: eliminaremos el elemento. - Otros: existen otras funciones como
margin()para establecer los márgenes de algún elemento ounit()para establecer dimensiones. También se puede modificar la posición de la leyenda como hemos visto en temas previos.
-
10.3.1 Elementos de texto
Cada función tiene unos elementos característicos. Por ejemplo, en element_text podremos modificar características como el tamaño de fuente, color de fuente, alineación del texto, ángulo del texto, etc. En el siguiente ejemplo se pueden explorar algunas de estas opciones:
iris_gg +
    theme_minimal() +
    theme(
        plot.title = element_text(
            face   = "bold",
            size   = 20,
            colour = "darkblue",
            hjust  = .5,
            margin = margin(b = 10, unit = "pt")
        )
    )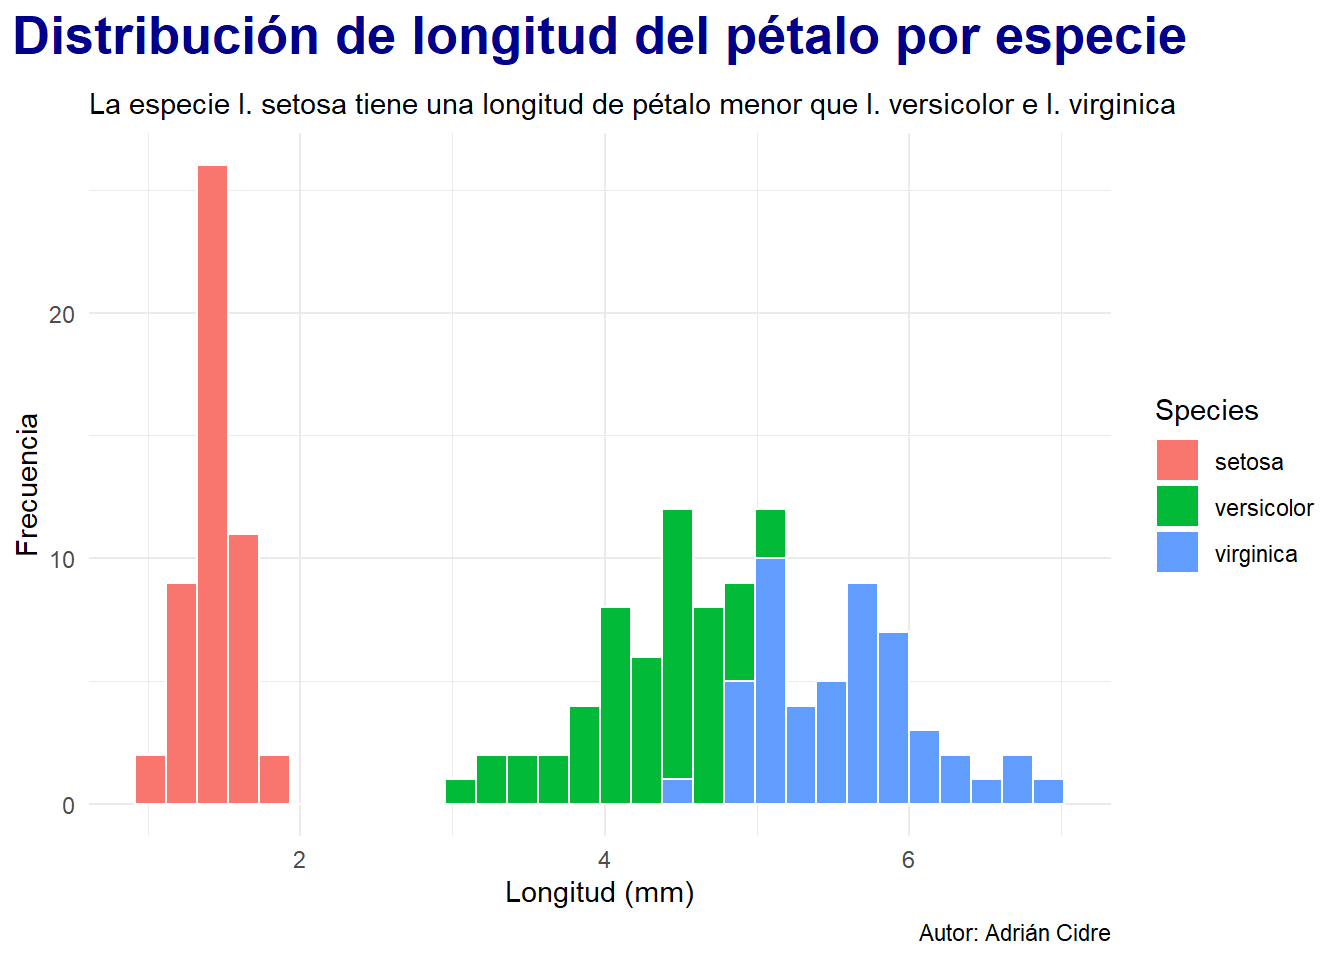
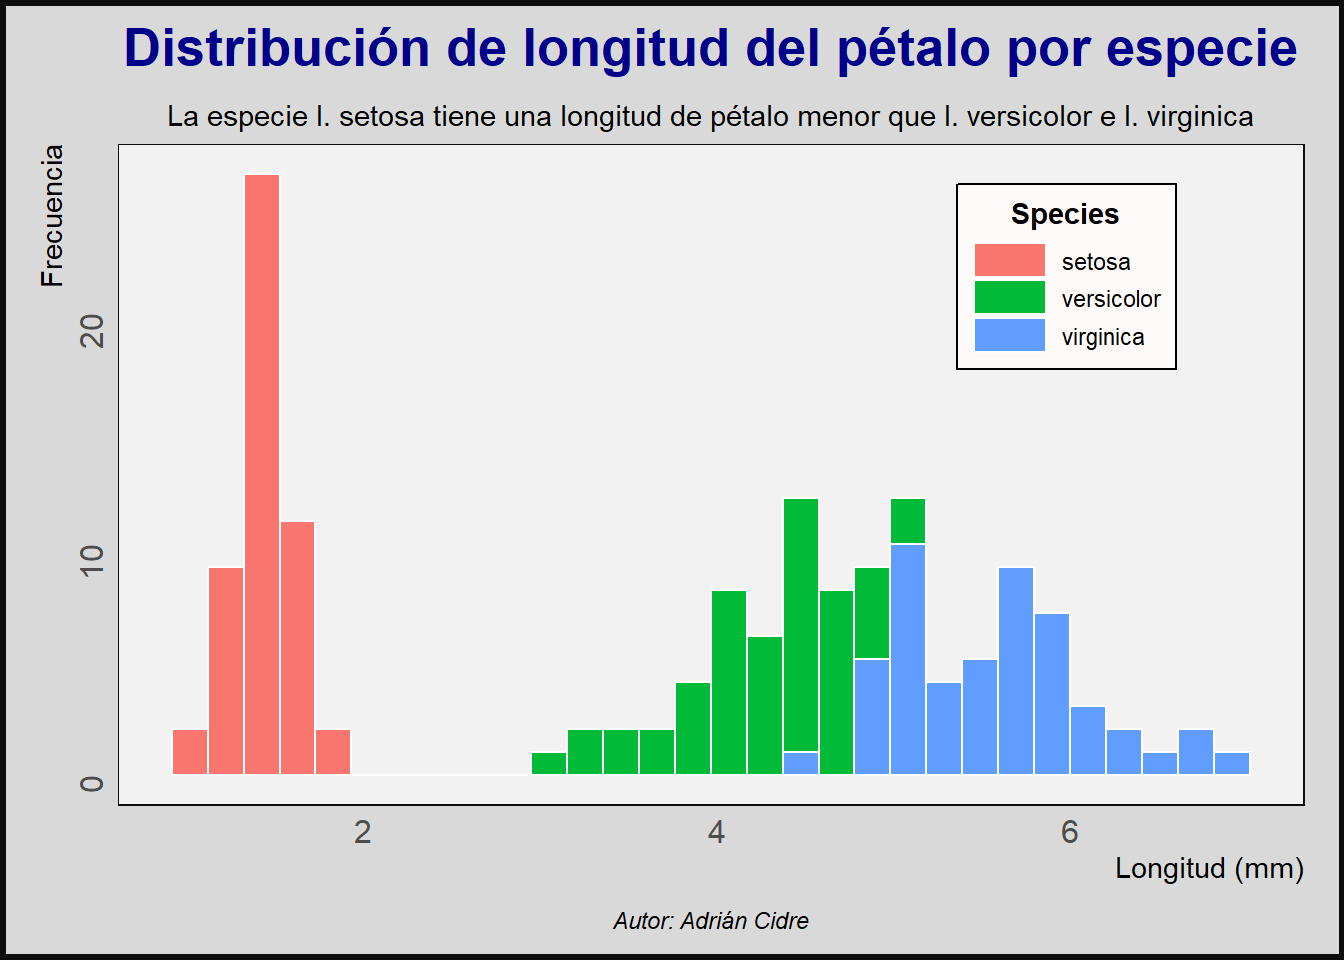
En este caso estamos modificando el título del gráfico. Lo convertimos a negrita (face = "bold"), con un tamaño de 20 puntos tipográficos (pt), color azul oscuro, justificación horizontal centrada y con un margen inferior (b = bottom) de 10 puntos. De este modo podemos modificar todos los elementos de texto:
iris_gg <- iris_gg +
    theme_minimal() +
    theme(
        ## Título del gráfico
        plot.title = element_text(
            face   = "bold",
            size   = 20,
            colour = "darkblue",
            hjust  = .5,
            margin = margin(b = 10, unit = "pt")
        ),
        ## Título de la leyenda
        legend.title = element_text(
            face  = "bold",
            hjust = .5
        ),
        ## Texto de los ejes X e Y
        axis.text = element_text(
            size = 12
        ),
        ## Texto del eje Y
        axis.text.y = element_text(
            angle = 90
        ),
        ## Títulos de los ejes
        axis.title = element_text(
            hjust = 1
        ),
        ## Pie de figura
        plot.caption = element_text(
            face  = "italic",
            hjust = .5,
            margin = margin(t = 10)
        )
    )

iris_gg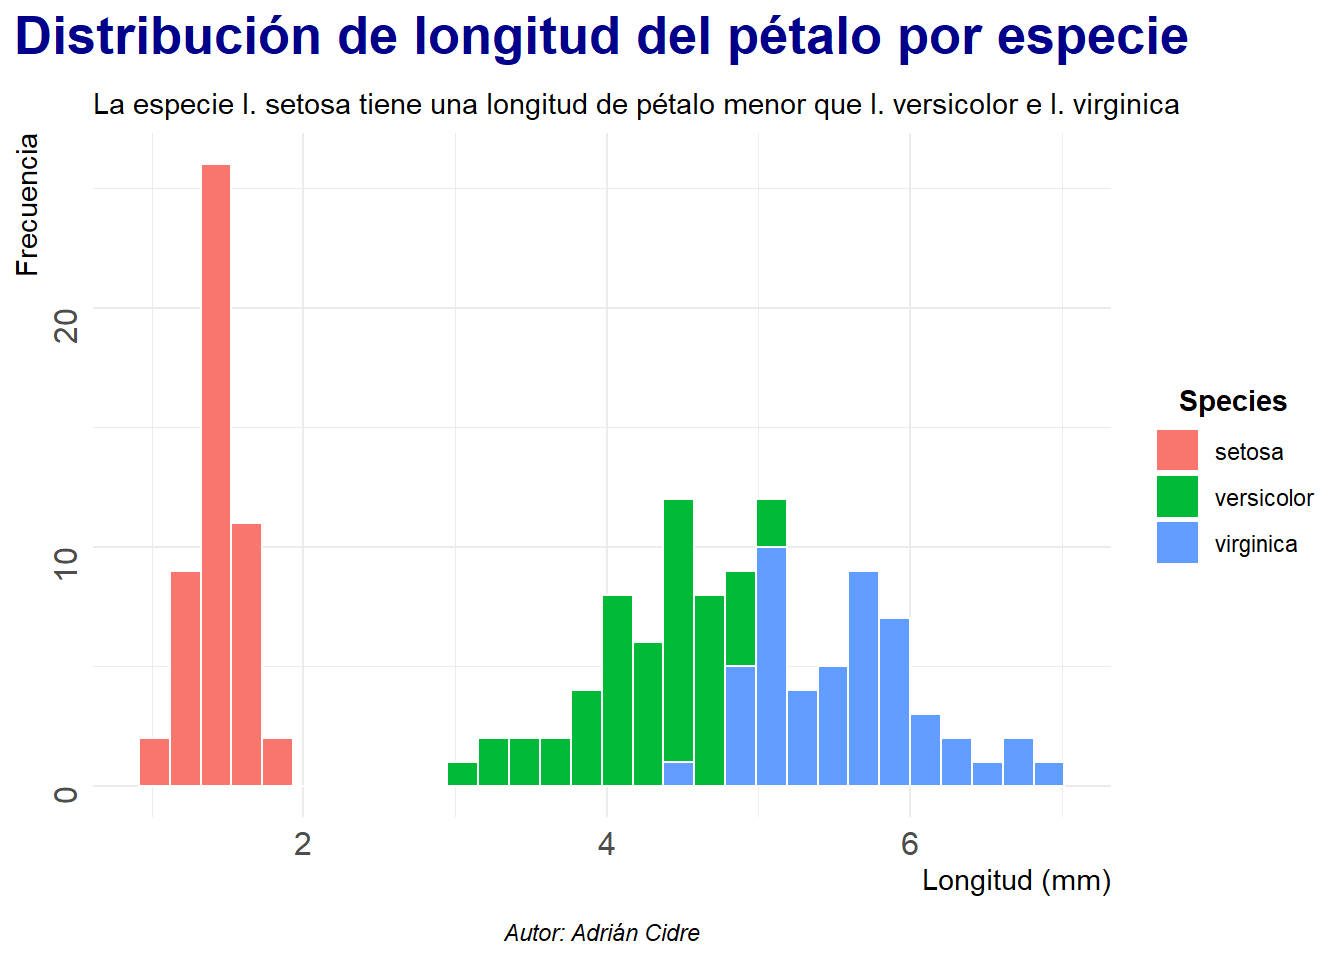
10.3.2 Elementos lineales
Los elementos lineales tienen argumentos característicos de las líneas como pueden ser: color, tipo de línea o grosor entre otros. Vamos a ver como modificar la grilla del gráfico:
iris_gg <- iris_gg +
    theme(
        ## Grilla mayor
        panel.grid.major = element_line(
            colour    = "gray30",
            linewidth = .5
        ),
        ## Grilla menor
        panel.grid.minor = element_line(
            colour    = "gray50",
            linetype  = 3,
            linewidth = .3
        ),
        ## Ticks
        axis.ticks = element_blank(),
        axis.line  = element_blank()
    )

iris_gg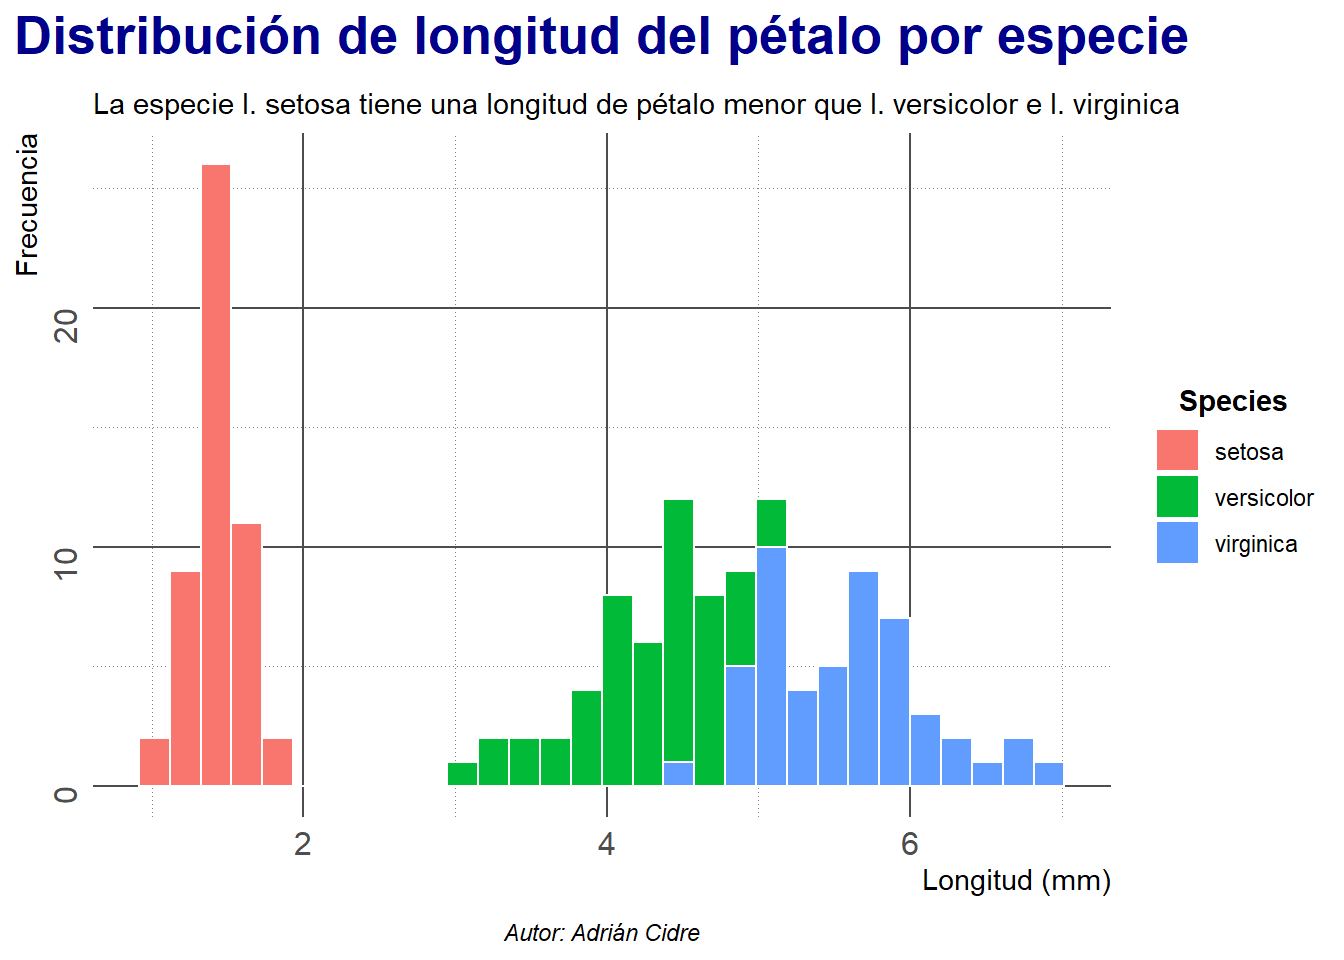
Este gráfico es un crimen, ya que la grilla resalta más que los propios datos. No obstante, es simplemente un ejemplo para que se pueda observar la influencia y función de cada uno de los argumentos.
10.3.3 Elementos rectangulares
Los elementos rectangulares tienen contornos (líneas) y relleno. Los contornos van a poder modificarse al igual que cualquier otra línea (color, tipo de línea, grosor …), mientras que el relleno tendrá el argumento fill para el color.
iris_gg <- iris_gg +
    theme(
        ## Panel del gráfico
        panel.background = element_rect(
            fill = "grey95",
            colour = "grey5"
        ),
        ## Panel + resto del gráfico
        plot.background = element_rect(
            fill      = "grey85",
            colour    = "grey5",
            linewidth = 2
        ),
        ## Leyenda
        legend.background = element_rect(
            fill   = "snow",
            colour = "black"
        )
    )

iris_gg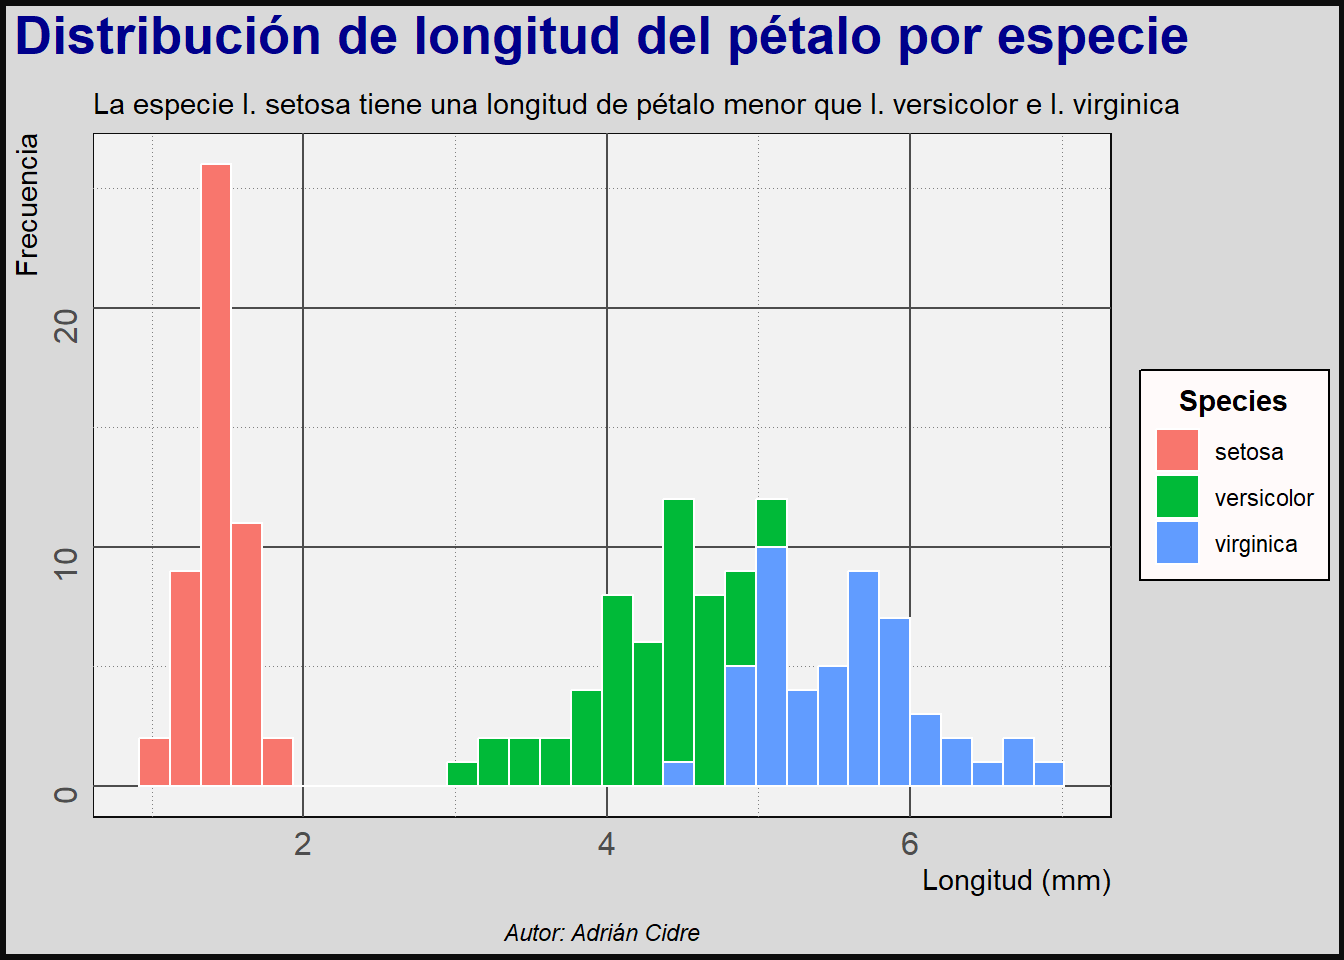
El elemento plot.background se refiere a todo el gráfico, envolviendo al panel. El panel.background es el rectángulo envuelto por los ejes.
10.3.4 Elementos vacíos
Para eliminar elementos, utilizamos element_blank().
iris_gg <- iris_gg +
    theme(
        panel.grid.minor = element_blank(),
        panel.grid.major = element_blank()
    )

iris_gg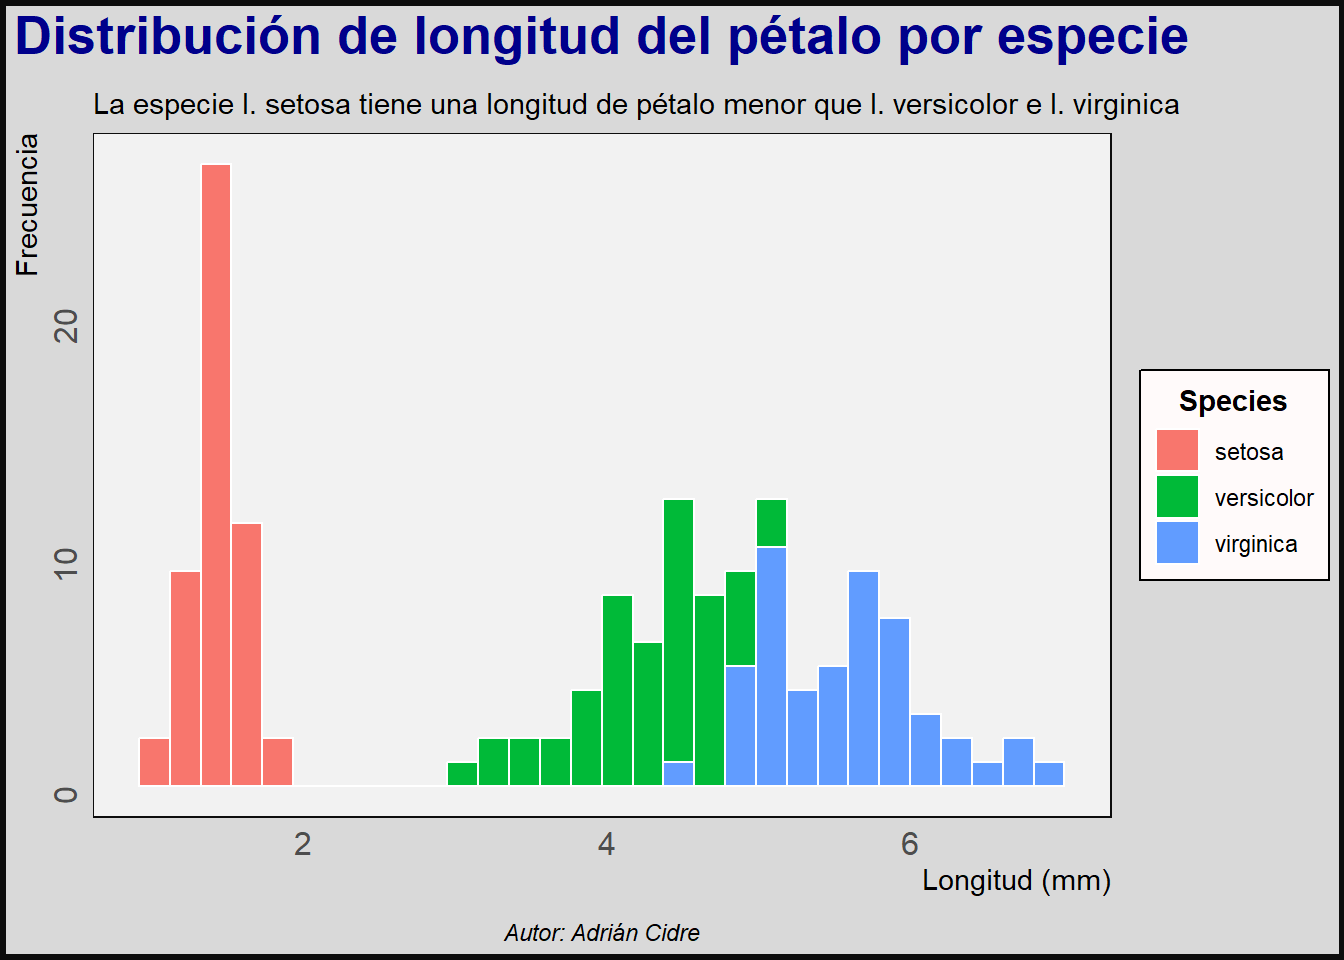
De este modo podemos eliminar la grilla que era horrible.
10.3.5 Márgenes
Los márgenes se pueden modificar con la función margin(). En la Sección 10.3.1 hemos visto un par de ejemplos de esta función que se puede utilizar dentro de element_text(margin = margin(...). No obstante, tenemos otros elementos a los que solamente podremos modificar el margen. Vamos a ver estos dos ejemplos de nuevo:
iris_gg <- iris_gg +
    theme(
        plot.subtitle = element_text(
            hjust = .5,
            margin = margin(b = 5)
        ),
        plot.margin = margin(
            t    = 10,
            r    = 15,
            b    = 10,
            l    = 15,
            unit = "pt"
        )
    )

iris_gg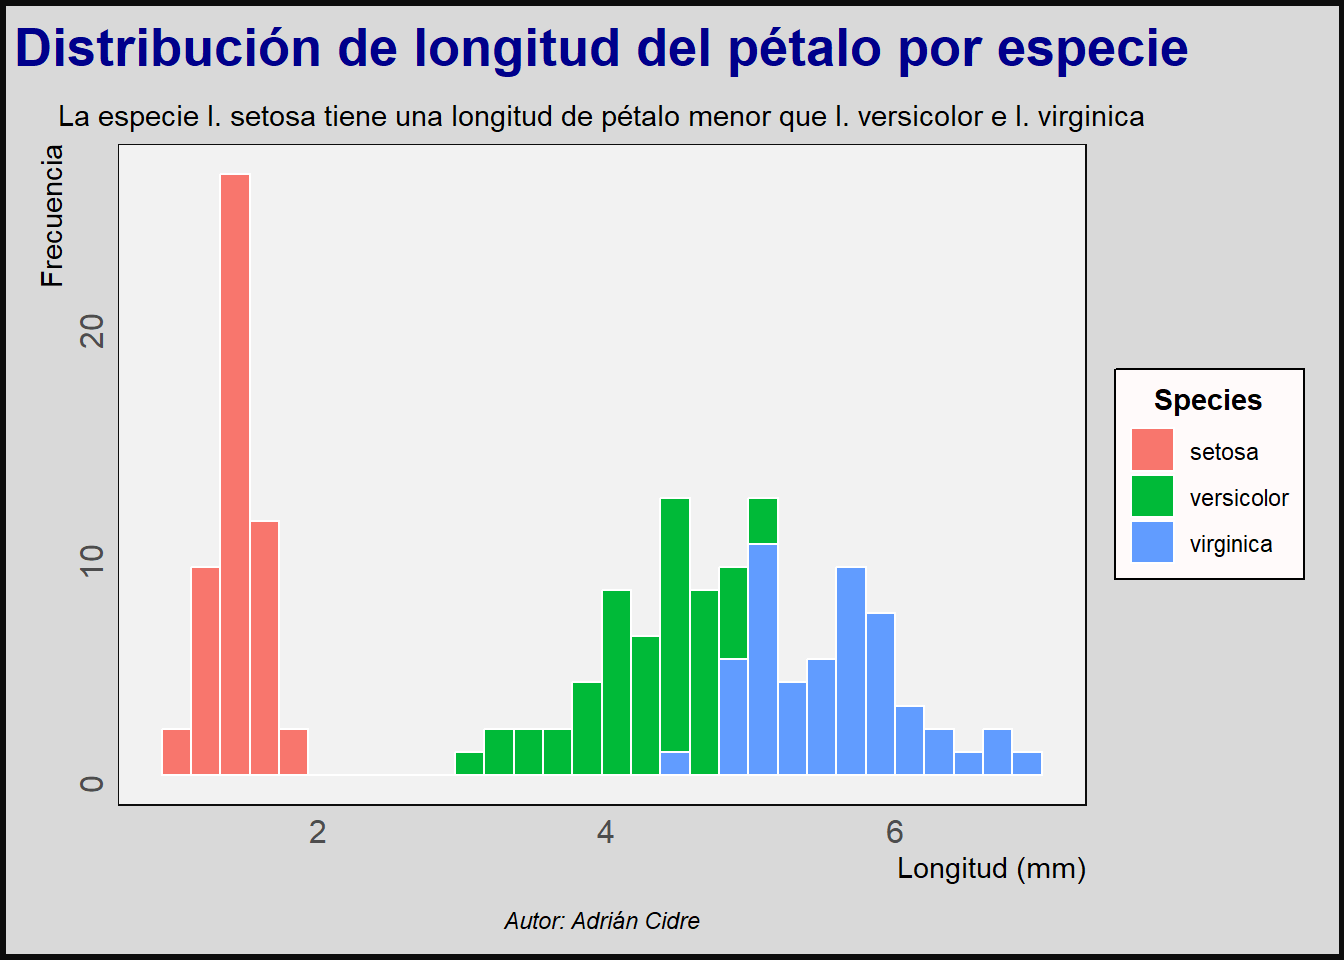
En este ejemplo vemos como añadir margen a un elemento de texto y al gráfico en su conjunto.
10.3.6 Leyenda
La leyenda tiene un par de elementos especiales:
-
Posición de la leyenda: la podemos modificar con:
legend.position.inside: lo igualamos a un vector numérico con coordenadas dentro del gráfico (entre 0 y 1). Este argumento debe ser usado en conjunto conguides.legend.position: para una posición absoluta (top, right, bottom, left). Todavía se puede utilizar un vector numérico en este elemento, pero esto ha quedado obsoleto en la versión 3.5.0 deggplot2y es posible que se elimine en un futuro cercano.
## Posición absoluta
iris_abs_gg <- iris_gg +
    theme(
        legend.position = "top"
    )

## Posición dentro del gráfico
iris_ins_gg <- iris_gg +
    guides(
        fill = guide_legend(
            position       = "inside"
        )
    ) +
    theme(
        legend.position.inside = c(.8, .8)
    )

## Visualizar ambos con patchwork
iris_abs_gg + iris_ins_gg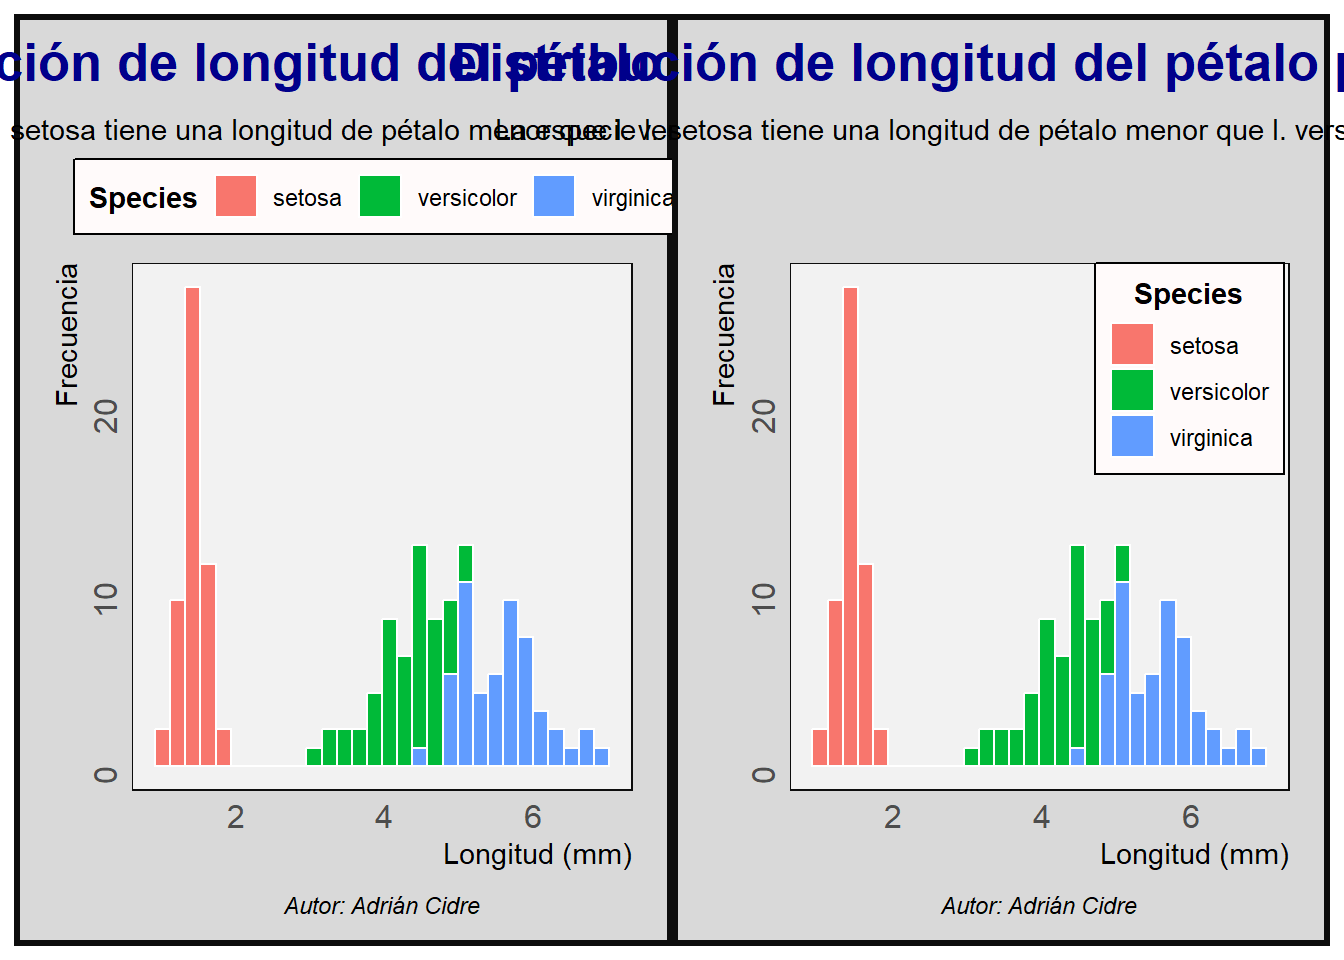
Otros elementos sobre los que podemos actuar dentro de theme son los iconos denominados keys. Podemos modificar su tamaño con la función unit() que toma dos argumentos: el tamaño y las unidades.
Existen muchos otros elementos con los que experimentar, pero entendiendo lo visto en este tema podréis ser capaces de modificar cualquier elemento de theme. Para explorar estos elementos podéis abrir la ayuda de la función ?theme.
10.4 Resumen
En este capítulo hemos visto el último componente de ggplot2 que son los temas. Tenemos temas predefinidos que en algunas ocasiones serán suficientes, aunque en la mayoría de las ocasiones vamos a modificar otros elementos. Tenemos tres clases de elementos principales: element_text, element_line y element_rect, que clasifican a los elementos según su forma: texto, línea o rectángulo. Cada una de estas clases tiene argumentos específicos que nos permiten personalizar nuestros gráficos de manera exhaustiva, brindándonos la capacidad de ajustar hasta el más mínimo detalle. De esta forma, la única limitación para el diseño de nuestros gráficos será nuestra propia creatividad.